Accreditation Information
ANNUAL REPORT (2024 for 2022-2023 Academic Year)
SPRING ARBOR UNIVERSITY SCHOOL OF EDUCATION
CAEP conducted an initial program (traditional undergraduate) accreditation visit of the Spring Arbor University School of Education in the fall of 2018. The site team reviewed the School of Education’s initial programs for Elementary Education, Secondary Education, Early Childhood Education, and Special Education. In addition, CAEP recognizes the CACREP accreditation for the Masters of Counseling program with a School Counseling component as the EPP’s only Advanced program.
A stipulation visit in December 2020, followed by the CAEP Council review resulted in the EPP satisfactorily meeting all accreditation requirements. The EPP is actively pursuing program evaluation and review in preparation for the next CAEP accreditation visit in 2025.
Program Improvement Statement
All report data in this Annual Report has been shared with the School of Education’s decision-making team, faculty, and partners for the purposes of our established ongoing program improvement process.
Measure 1 – Impact Measure R4.1: Completer Effectiveness
The Spring Arbor University School of Education has selected the following evidence as indicators of the impact SAU completers have on the learning and development of P-12 learners and their ability to apply professional knowledge, skills and dispositions in P-12 classrooms.
SAU Completer Effectiveness Data – (EOY) Evaluation Ratings
The Michigan Department of Education annually provides EPPs with five cycles of end of year evaluation (EOY) ratings for their completers employed in Michigan public schools. All Michigan public school teachers are required by law to receive an annual evaluation using one of five state approved evaluation instruments. In addition, the law stipulates that 40% of every teacher’s annual evaluation rating be based on student growth and assessment data. The EPPs do not receive specific student growth/assessment markers from the MDE EOY evaluation data. However, the student growth/assessment markers are imbedded within the evaluation rating each teacher receives on their end of year evaluation. Also embedded within the evaluation rating is the professional disposition practices of teachers.
Teachers may receive an EOY evaluation rating of: Highly Effective, Effective, Minimally Effective, or Ineffective. Ratings of Highly Effective and/or Effective indicate satisfactory performance and include the factoring of meeting student growth/assessment goals (40% of the evaluation) established by the school/district, thus effectively contributing to P-12 student-learning growth (CAEP R4.1) and provides evidence of completers’ satisfactory performance of professional knowledge, skills, and disposition practices (CAEP R4.1). Ratings of Highly Effective or Effective are evidence toward meeting CAEP criteria for reporting Satisfaction of Employees (CAEP R4.2).
Review this Guide for understanding how one SAU Partner School determines the positive impact on student learning for rating annual teacher performance levels.
The end of year evaluation ratings in this year’s report covers the year’s 2019-2020, 2020-2021, and 2022-2023. A total of 262 end of year evaluations (n=262) were reported for 130 Spring Arbor University Completers (n=130).
Data Highlights
- 130 = Total Number of Completers Receiving EOY Evaluations
- 98% = Completers rated Highly Effective and/or Effective
- 17 (13.8%) = Year 1 – Number of Completers Receiving Highly Effective Rating
- 18 (14.6%) = Year 2 – Number of Completers Receiving Highly Effective Rating
- 13 (10.6%) = Year 3 – Number of Completers Receiving Highly Effective Rating
- 10 (7.7%) = Year 4 – Number of Completers Receiving Highly Effective Rating
Refer to the following link to access this report:
SAU Completer Effectiveness Data – (EOY) Evaluation Ratings
MDE Administrator Survey of First Year Teachers (2022-2023)
The Michigan Department of Education (MDE) conducts a yearly survey among school administrators with the intent to measure the teaching practices of first year teachers. The MDE identified EPP first year teachers and matched each to the school where they completed their first year of service. The MDE requested school administrators to complete a survey on the identified first year teacher(s).
The results of the 2022-2023 survey revealed that statewide, administrators completed surveys on 548 (n=548) first year teachers. For Spring Arbor University, 10 (n=10) first year teachers were included in the survey results.
The survey consisted of 21 questions framed within four components:
- Teacher instructional practices
- Teacher application of instructional practices and resources to supported targeted student groups.
- Relationship building with targeted groups
- Professional disposition practice
School administrators were also provided with the option of providing comments at the end of the survey.
Data Highlights
EPP completers’ survey items scores highlighted below were selected because the EPP rating was not less than 5% of the state average and/or the EPP ratings were the same as, or above the state average:
- Supporting all students in making connections to prior knowledge and experiences (100%).
- Utilizing technology to enhance the learning experience of students (100%).
- Understand and make accommodations based on a student’s IEP or Section 504 plan (90%).
- Applying instructional strategies and resources to support students experiencing trauma (90%).
- Building positive relationships with students (100%), families/caregivers (100%), and colleagues (100%).
- Demonstrating responsiveness and flexibility to unexpected situations which arise (100%).
- Act in a manner consistent with ethical and professional educator expectations.
Refer to the following link to access this report:
MDE Administrator Survey of First Year Teachers (2022-2023)
SAU Completer Effectiveness Case Study
Eight EPP completers (n=7) and submitted 2022 annual end of year evaluation and/or submitted documentation of their impact on student learning and development.
All completers (n=8) received 2023 EOY ratings of “Effective.”
Seven (n=7) SAU completers submitted evidence of student growth scores.
Data Highlights
| Completer | Years Experience | Level Content | EOY Rating | Student Growth | Professional Practice |
| SF – female | 1 | Secondary – Math | Effective | Not reported | Not reported |
| BB – male | 2 | Secondary – Math | Effective | 3.25 | 3.17 |
| LB – female | 2 | Secondary- Social Studies | Effective | Not reported | Not reported |
| CB – female | 1 | Elementary | Effective | Not reported | Not reported |
| DH – female | 1 | Secondary – Choir | Effective | 2.8 | 3 |
| WH – male | 1 | Secondary – Science | Effective | 3 | 3 |
| CH- female | 2 | Secondary – Special Education | Effective | Not reported | Not reported |
| JO – male | 1.5 | Elementary – Special Ed | Effective | 75% | 80.5% |
Refer to the following link to access this report:
SAU Satisfaction Surveys (Administrator & Beginning Teacher)
In addition, school administrators and beginning teachers (completers) are requested to answer a question regarding their effectiveness and/or ability to contribute to learning growth / development of their students.
Administrator Satisfaction Survey Question #28: Spring Arbor University trained teacher has effectively contributed to the learning-growth of their students?
- Strongly Agree (n=19; 57.58%)
- Agree (n=14; 42.42%)
- Disagree (n=0)
- Strongly Disagree (n=0)
Beginning Teacher Satisfaction Survey Question #38: CAEP Accreditation standard R4.1 requires the School of Education to demonstrate that our graduates effectively contribute to P-12 student learning growth. In your teaching last year, and/or currently, are you meeting the expected learning / development goals for your students?
- Yes (n=32; 86.5%)
- Choose Not to Answer (n=5; 13.5%)
- Partnership Teacher Effectiveness Ratings. The Spring Arbor University School of Education has signed partnerships with nine local school districts and one charter academy (total = ten partnerships). End of Year evaluations of SAU trained teachers employed by partner school districts for 2019, 2020, 2021, 2022, 2023 indicated that:
- 100% of SAU trained teachers hired to teach in partner districts/schools were rated “effective” or “highly effective” on the 2022 EOY evaluations.
- 130 = Total Number of Completers Receiving 2023 EOY Evaluations (Highly Effective / Effective)
- 50 = Number of Completers employed as teachers by Partner & Area Schools
- 100% (n=50) were rated “Highly Effective” or “Effective” by their school building administrator.
- 38.5% = Percent of SAU Completers employed as teachers by Partner & Area Schools in 2023. (EOY 2019-2023 SA Summary Data, p. 3)
Refer to the following link to access this report:
2019-2023 EOY Summary Data
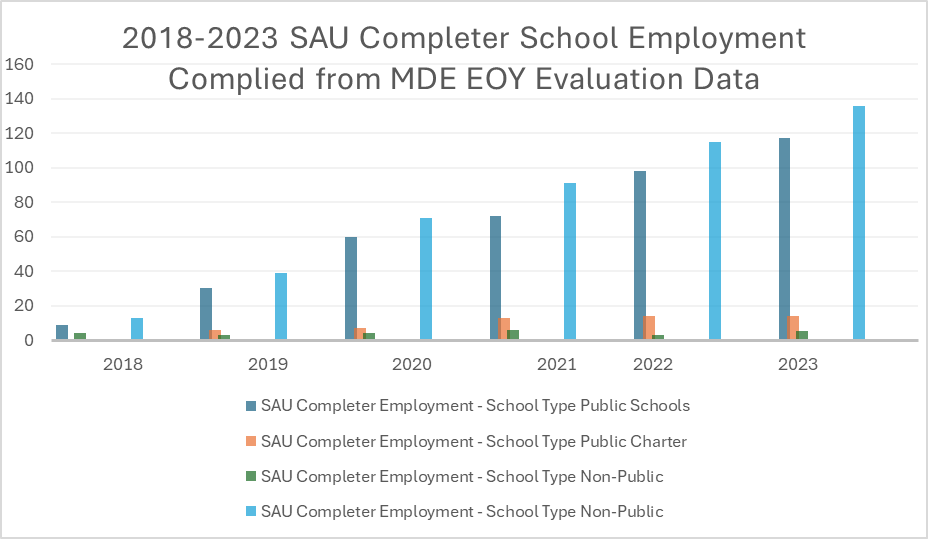
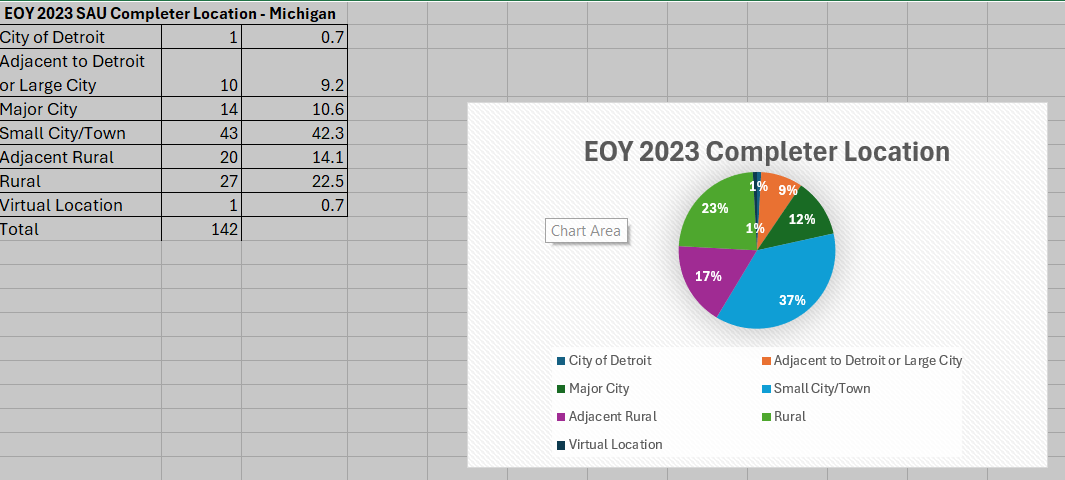
Completer Employment Demographics (2018-2023)
MDE End of Year Evaluation data helped identify where SAU trained teachers were employed across the state of Michigan.
- SAU trained teachers are contributing to student learning in multiple types of schools and settings across the state of Michigan.
Measure 2 – Impact Measure R4.2: Employer Satisfaction
The Spring Arbor University School of Education has selected the following evidence as indicators of employer satisfaction with the preparation and performance of EPP completers.
SAU Completer Effectiveness Data – (EOY) Evaluation Ratings
The Michigan Department of Education annually provides EPPs with five cycles of end of year evaluation (EOY) ratings for their completers employed in Michigan public schools. All Michigan public school teachers are required by law to receive an annual evaluation using one of five state approved evaluation instruments. Teachers may receive an EOY evaluation rating of: Highly Effective, Effective, Minimally Effective, or Ineffective. Ratings of Highly Effective and/or Effective indicate satisfactory performance and include the factoring of meeting student growth/assessment goals (40% of the overall evaluation) established by the school/district, thus effectively contributing to P-12 student-learning growth (CAEP R4.1), and provides evidence of completers’ satisfactory performance of professional knowledge, skills, and disposition practices (CAEP R4.1). By law, teachers receiving ratings of Minimally Effective are given one year to raise their rating or be dismissed by the school district whereas, teachers receiving an Ineffective rating are immediately terminated from service. There is an overall strength of consensus among the Michigan Department of Education, school districts, and EPPs that teachers receiving a rating Highly Effective or Effective is evidence toward meeting CAEP criteria for reporting Satisfaction of Employers (CAEP R4.2).
The end of year evaluation ratings in this year’s report covers the years 2018-2019, 2019-2020, 2020-2021, 2021-2022, and 2022-2023. During that time, a total of 130 Spring Arbor University Completers (n=130) received EOY evaluations resulting in a total of 262 annual evaluation ratings (n=262) over the five-year period.
Data Highlights
- Seventy-one evaluations (n=71; 37%) rated EPP completers as Highly Effective.
- Ninety-seven evaluations (n=97; 51%) rated EPP completers as Effective.
- Zero evaluations (n=0; 0%) rated EPP completers as Minimally Effective.
- There were no Ineffective evaluation ratings received by EPP completers. Combined, 100% of the EPP completers received ratings of Highly Effective or Effective for the reporting period.
- 12% EPP completers did not have a recorded evaluation.
- The total attrition rate for EPP completers over five years was 1.9%.
Refer to the following link to access this report:
- EPP Administrator Satisfaction Survey
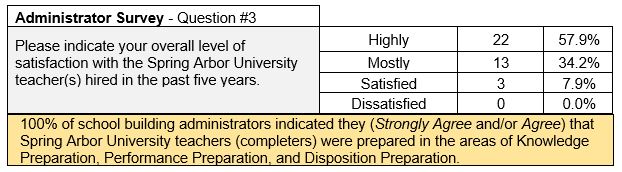
The EPP incorporates a satisfaction survey specifically designed to meet the CAEP criteria for EPP created surveys. School building administrators employing EPP Completers are contacted (email) to complete the survey which measures EPP completers’ knowledge, performance, and dispositional preparation. In addition, the survey directly asks school building administrators to indicate their level of satisfaction with the EPP completers hired. Thirty-eight (n=38) school administrators completed the survey on 49 completers (n=49).
Data Highlights
Refer to the following link to access this report:
- 2023 EPP Administrator & Beginning Teacher Satisfaction Survey Results
- EPP Administrator Satisfaction Survey Instrument
Partnership Teacher Effectiveness Ratings
The Spring Arbor University School of Education has signed partnership agreements with nine local school districts and one charter academy (n = 10 partnerships). End of Year evaluations of SAU trained teachers employed by partner school districts for 2019, 2020, 2021, 2022, and 2023 indicated that:
100% of SAU trained teachers hired to teach in partner districts/schools were rated “effective” or “highly effective” on the 2023 EOY evaluations.
- 130 = Total Number of Completers Receiving 2022 EOY Evaluations (Highly Effective / Effective)
- 50 = Number of Completers employed as teachers by Partner & Area Schools100% (n=50) were rated “Highly Effective” or “Effective” by their school building administrator.
- 38.5% = Percent of SAU Completers employed as teachers by Partner & Area Schools in 2023. (EOY 2019-2023 SAU Summary Data, p. 3)
Refer to the following link to access this report:
Spring Arbor University Promise
“The Promise” proclaims that any teacher from a School of Education program who receives an annual evaluation rating less than “effective” may appeal to the School of Education for mentoring and ongoing faculty support to remedy any areas of deficiency as defined in the annual teacher evaluation.
- Since its initiation in 2012, only two SAU trained teachers have sought assistance from the School of Education Promise.
Refer to the following link to access this report:
Additional Measure – Impact Measure 4.3: Satisfaction of Completers
(The EPP understands that this is not a required impact measure for the 2023 Annual Report but considers the data presented to be valuable in understanding completer perceptions of their preparation as beginning teachings.)
MDE Year Out Survey of First Year Teachers (2022-2023)
The Michigan Department of Education (MDE) conducts an annual survey among EPP completers hired as first year teachers. The intent of the survey is to measure aspects of the completers’ preparation and satisfaction with their preparation as a beginning teacher. The MDE identifies and contacts first year teachers with a request to complete the 44-question survey and answer four questions. Surveys were completed by six hundred and four (n=604) statewide completers. Six EPP completers (n=6) in their first year of teaching responded to the survey.
Data Highlights
EPP completers’ survey ratings were above the state averages in six of the seven category summaries.
| Category Summary | State Average (n=548) | EPP Average (n=5) |
| Overall Preparation | 85.2% | 80% |
| Meeting Student Needs | 69.8% | 82% |
| Technology | 81.3% | 90% |
| Instructional Strategies & Assessment | 72.2% | 75.6% |
| Professionalism | 86.2% | 86.7% |
| Clinical Experience & Program Prep | 71.5% | 76.7% |
EPP identified areas below the state average for the Professionalism category included:
- Advocating for yourself as a teacher in a professional and productive manner. State Average: 76.1%; EPP Average: 60%
EPP completers rated one other item below the state average for the support and feedback they received from their cooperating teacher(s) during student teaching (State Average: 87.8%; EPP Average: 83.3%)
EPP completers also provided the following comments:
Question: Do you have additional elements of your preparation program you feel made a positive contribution to your readiness to begin a teaching career?
Answers: No responses given.
Question: What do you believe your educator preparation provider did especially well?
Answers:
- Did provide fast and accurate feedback to everyone.
- Yes, I was not a traditional student
Question: What do you believe your educator preparation provider needs to improve upon?
Answers:
- Nothing
- The EPP needs to improve on instructing future teachers on how to manage minor and major behaviors in the classroom.
Question: If you had advice for candidates enrolled in a program within your educator preparation provider, what would it be?
Answers:
- Do not be afraid to ask for help.
- Make connections with teachers before you begin student teaching.
- Remember to flexible because schedules change and student needs change.
- Don’t be afraid to make mistakes
Refer to the following link to access this report:
Beginning Teacher Survey
The EPP identified the email addresses of 124 completers employed as teachers from 2018 through 2022 and invited each to complete the survey. Thirty-seven (n=37) completers responded to the survey (30% Return Rate).
The survey is developed with three sections. Part one provides general employment and demographic information as well as information regarding the length of time taken to gain employment, the preparation for job interviews, whether they have advanced in a leadership role at their school, their professional goals, and a general evaluation of the teacher preparation they received from the EPP.
Part two, is composed of questions organized within three central themes: Knowledge Preparation, Performance Preparation, and Dispositional Preparation. For this part of the survey, completers used a 4-Point Likert Scale: 4= Strongly Agree, 3 = Agree, 2 = Disagree, 1 = Strongly Disagree.
The last part of the survey requests completers to upload evidence of their teaching effectiveness and to identify if they would be willing to provide program improvement expertise to the EPP.
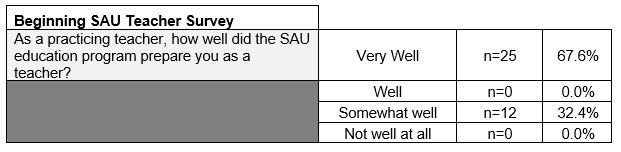
Data Highlights
The EPP averaged the completers’ ratings for each component of the survey:
- 100% of the completers (n=37) identified that the EPP prepared them as teachers “Very well” or “Somewhat well.”
- 89.3% of the completers (n=37) strongly agreed or agreed that EPP prepared them in the survey areas associated with Knowledge preparation.
- 88.5% of the completers (n=37) strongly agreed or agreed that EPP prepared them in the survey areas associated with Performance preparation.
- 91% of completers (n=37) strongly agreed or agreed that EPP prepared them in the survey areas associated with Dispositional Preparation.
- 89% of completers (n=33) responded that they are meeting their school / school district’s expected learning / development goals for their students. Four (n=4) completers choose not to answer the question.
- Twenty-three completers (n=23; 62%) provided comments which complemented the teacher preparation they received. The EPP will review and analyze the comments at an upcoming data retreat.
Refer to the following links:
- 2023 EPP Administrator & Beginning Teacher Satisfaction Survey Results
- 2023 Completer Survey Comments
- 2023 Beginning Teacher Satisfaction Survey
Measure 3 – Impact Measure R3.3 Candidate Competency at Program Completion
The EPP has selected the following evidence for R3.3
The EPP measures candidate competency at completion in multiple ways. The student teaching internship is the last and final experience for candidates to demonstrate and be assessed as competent in the skills associated with beginning teachers. Additionally, candidates are required to pass their respective certification test to become certified teachers in the state of Michigan.
Incorporating two proprietary assessments: the Charlotte Danielson Framework for Teaching (CDF) and the Educator Disposition Assessment (EDA), the student teachers’ (candidates’) classroom (mentor) teachers and university supervisors complete a final evaluation on each candidate.
The Charlotte Danielson Framework for Teaching instrument incorporates 22 elements within four domains: Preparation and Planning, the Classroom Environment, Instruction, and Professional Responsibilities. Each element is assessed on a 4-point Likert scale: 1 = Ineffective, 2 = Minimally Effective, 3 = Effective, and 4 = Highly Effective. Student teachers are expected to establish an overall rating of 3 “Effective” by both the classroom (mentor) teacher and university supervisor assessments to meet the criteria for successful competency during student teacher.
The Educator Disposition Assessment incorporates 9 elements assessed on a 3-point Likert scale: 1 = Developing (In Need of Immediate Remediation), 2 = Needs Improvement, and 3 = Meets Expectations. Student teaching candidates are expected to establish an overall rating of 3 “Meets Expectations” by both the classroom (mentor) teacher and university supervisor to meet the criteria for successful competency during student teacher. In the event the student teachers does not meet the rating of 3 “Meets Expectations” the overall assessment is reviewed and the EPP determines any warranted further improvement action steps.
The EPP also incorporates a simple survey for the classroom (mentor) teacher and university supervisor to state whether they support the candidate becoming a certified teacher. The survey requires the classroom (mentor) teachers and the university supervisor to identify whether they recommend the candidate for certification. Student teaching candidates are expected to establish an overall rating of 3 “Recommend for Certification” by both the classroom (mentor) teacher and university supervisor to meet the criteria for successful competency during student teacher. In the event the student teacher candidate receives a rating of “Recommend for Certification” by one assessor and “Recommend with Reservations” by the second assessor, the EPP reviews the CDF and EDA assessments and determines whether or not to recommend the candidate for teacher certification.
Thirty candidates (n=30; FA22-SP23) completed student teaching internship in elementary and secondary experiences. 86% (n=26) meet the criteria established for by the EPP for meeting the competency expectations related to the three assessment measures presented above.
- An additional measure of completer competency is the number of completers who passed their certification test (Michigan Test for Teacher Certification [MTTC]). Of the 30 elementary and secondary candidates, elementary candidates (n=20; 85%) passed the certification test and became certified teachers in the state of Michigan. Among the secondary candidates (n=10), nine candidates passed the certification test (n=10; 90%) and became certified teachers in the state of Michigan. One of the two secondary candidates who did not pass the certification test did so in the FA22 semester. The other candidate not passing the certification test decided to pursue employment outside of teaching.
Measure 4 – Impact Measure 4.4: Ability of Completers to be Hired in Education Positions for which they are Prepared
The EPP has selected the following evidence for this section of the report.
- Incorporating data from the MDE End of Year Evaluations and personally contacting each completer (2022-2023), the EPP determined the following:
- 29 individuals (n=30; 91%) completed the program successfully
- 26 completers (n=30; 87%) became certified teachers
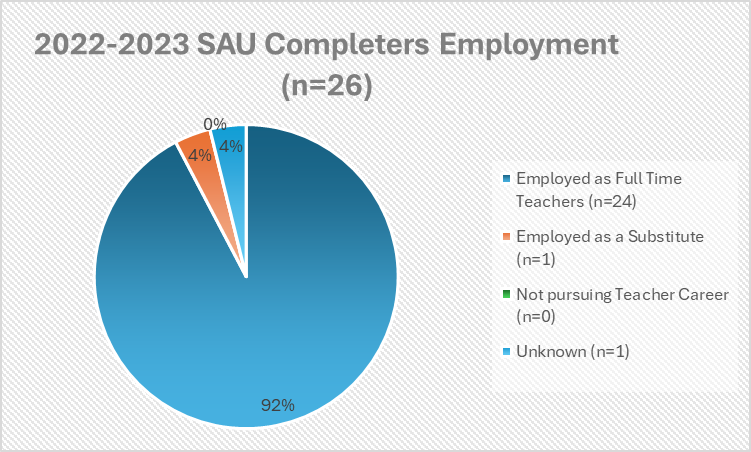
- 26 completers (n=26; 100%) became employed teachers
- Elementary (n=20) 10 Full Time, 0 Part Time, 0 Not Teaching = 100%
- Secondary (n= 10) 9 Full time, 1 Unknown = 90%
- Post BA Accelerated Elementary (n=7) 7 Full Time, 0 Unknown = 100%
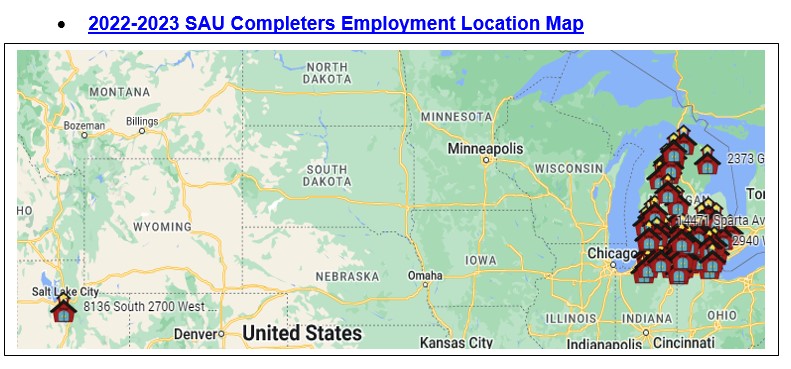
Location of EPP Teachers (2022)
Completer Employment – School Type (2018-2022)

2023 Beginning Teacher Satisfaction Survey
Data Highlights
The EPP averaged the completers’ ratings for each component of the survey:
- 98.4% of the completers (n=37) reported full time employment as teachers. One completer (n=1; 2.7%) reported they are teaching part-time.
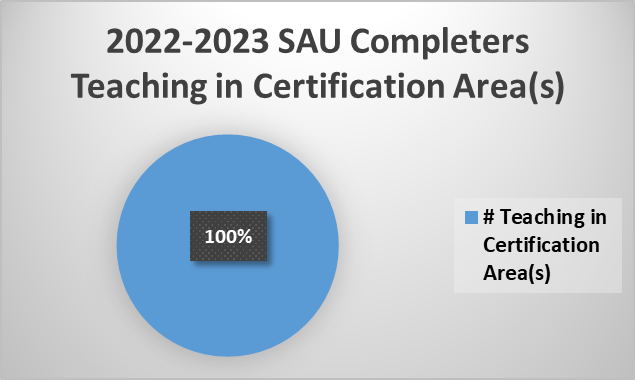
- 94.59% of the completers (n=35) identified that they are teaching within their certification area. Two completers (n=2; 5.41%) identified that they are teaching outside their certification area (Question 9, Beginning Teacher Satisfaction Survey).
- Thirty-seven completers (n=37) responded that it took the following length of time for them to obtain a teaching job.
- n=23 (62.16%) reported they found employment immediately.
- n=10 (27%) reported that they found employment in less than three months.
- n=2 (5.41%) reported that they found employment in 4 to 6 months.
- n=2 (5.41%) reported that they found employment in 7 to 12 months. (Question 10, Beginning Teacher Satisfaction Survey).
Refer to the following links:
Other Accreditation Information
Recent Comments